In today’s fast-paced organizations, understanding how employees actually use business platforms is crucial. Productivity gaps, compliance risks, and missed opportunities often stem from something as simple as:
- Late logins
- Long idle periods
- Early logouts
Yet many companies lack a clear, automated way to monitor these behaviors in their ServiceNow environment.
That’s where the User Engagement Monitor developed and delivered by DSS comes in.
Built on the ServiceNow platform, this application empowers administrators to track daily user activity, highlight potential productivity challenges, and generate actionable insights without manual log analysis or custom one-off scripts. It turns raw session and transaction data into meaningful, visual reports and dashboards.
With the built-in Idle Time Tracking, the app now goes beyond simple “logged in vs logged out” and helps you understand how effectively users spend their time inside ServiceNow.
Why Monitoring Engagement (and Idle Time) Matters
Most organizations manage user engagement reactively. Problems show up:
- after deadlines slip,
- after compliance checks fail,
- or after teams complain about inefficiency.
Without good visibility, it’s hard to answer basic questions:
- Are employees logging in on time for their scheduled shifts?
- Who is consistently leaving earlier than expected?
- How much active time is actually spent working in ServiceNow?
- Are long sessions truly productive - or just windows left open?
- Which teams might need training, support, or process improvements?
The User Engagement Monitor provides clear answers to these questions.
By automatically analyzing login/logoff patterns and idle periods, the app highlights trends before they become serious issues. Managers and admins can act proactively, not just react to problems.
Key Features of the User Engagement Monitor
The solution combines automation, flexibility, and ease of use. All features are delivered together in one update set, so you deploy everything in a single batch.
1. Late Login Detection
- The app compares actual login times against your configured shift start and late cutoff times (e.g., shift start at 09:00, late after 09:30).
- If a user logs in after the cutoff, the session is flagged as a late login.
- This lets you spot recurrent tardiness across individuals, teams, or locations.
2. Early Logout Identification
- In the same way, the app detects users who log out before the configured shift end (e.g., 18:00).
- These sessions are tagged as left early.
- Managers gain visibility into compliance with working hours and coverage expectations.
3. Configurable Shift Properties
No hardcoded times.
Administrators configure system properties for:
- Shift start time
- Shift end time
- Late login cutoff time
This allows flexibility for:
- Different departments or teams
- Multi-time-zone operations
- Changing business rules over time
All adjustments are done through system properties, without touching code.
4. Comprehensive User Activity Summary
All captured data is stored in a dedicated User Activity Summary table.
For each session, the app records:
- User
- Login time
- Logout time (adjusted based on session/end time)
- Session duration
- Late login flag
- Early logout flag
- Idle time (minutes)
- Active time (duration minus idle)
This table becomes the single source of truth for user activity and can be used in:
- Dashboards
- Reports
- Audits and reviews
5. Idle Time Tracking
Traditional metrics (login, logout, session duration) can be misleading: a user can be logged in for 8 hours but actually active for much less.
Idle Time Tracking solves this by analyzing data in syslog_transaction and identifying gaps between meaningful user actions (form loads, list views, reports, searches, etc.).
- Any gap longer than a configurable idle threshold (e.g., 10 minutes) is counted as idle time.
- The app then calculates active time = session duration – idle time.
This provides a much more realistic view of productivity and engagement.
6. Dashboards and Reports
The User Engagement Monitor includes ready-to-use dashboards and reports that show, for example:
- Number of late logins per day
- Users leaving early
- Average session durations
- Idle time per session
- Total idle time per user per day
- Comparison of active vs idle time
- Users exceeding idle time warning thresholds
These visual insights make it easy to spot trends and outliers and share findings with team leaders.
7. Automated Logic: Script Includes & Scheduled Jobs
Under the hood, the solution is powered by:
7.1 Script Includes
- Retrieve the relevant session information from system tables.
- Calculate late/early flags and session durations.
- Analyze syslog transactions to determine idle time.
7.2 Scheduled Script Executions
- One job builds and updates the User Activity Summary with login/logout and shift adherence.
- Another job calculates idle time for all sessions and updates the summary table.
Both jobs run automatically (e.g., daily) and can also be executed manually for testing or backfilling data.
8. Key Benefits for the Business
- The User Engagement Monitor is more than a technical utility - it’s a business tool.
8.1 Increased Productivity
- Identify patterns of late starts, early exits, and excessive idle time. This helps managers address recurring issues and support performance improvements.
8.2 Better Compliance
- Shift adherence and activity logs demonstrate that organizational policies around working hours and engagement are being respected.
8.3 Operational Efficiency
- Automated monitoring removes the need for manual checks in logs or ad-hoc reports, freeing admins for higher-value work.
8.4 Data-Driven Decisions
- Dashboards and summary data give leadership clear, visual insights into how teams use ServiceNow - supporting decisions around staffing, training, and process optimization.
9. Step-by-Step: How to Install and Use the User Engagement Monitor
→ You can download the XML file for the User Engagement Monitor from this link.
→ You can download the step-by-step guide to install and use the User Engagement Monitor.
Step 1: Import the Update Set
1. Go to System Update Sets > Retrieved Update Sets.
2. Click Import Update Set from XML.
3. Upload the combined update set file for User Engagement Monitor.
4. After import, open the retrieved update set record.
5. Click Preview Update Set to check for errors or conflicts.
6. If everything looks good, click Commit Update Set to apply all components (tables, Script Includes, Scheduled Jobs, Dashboards, Properties, etc.).
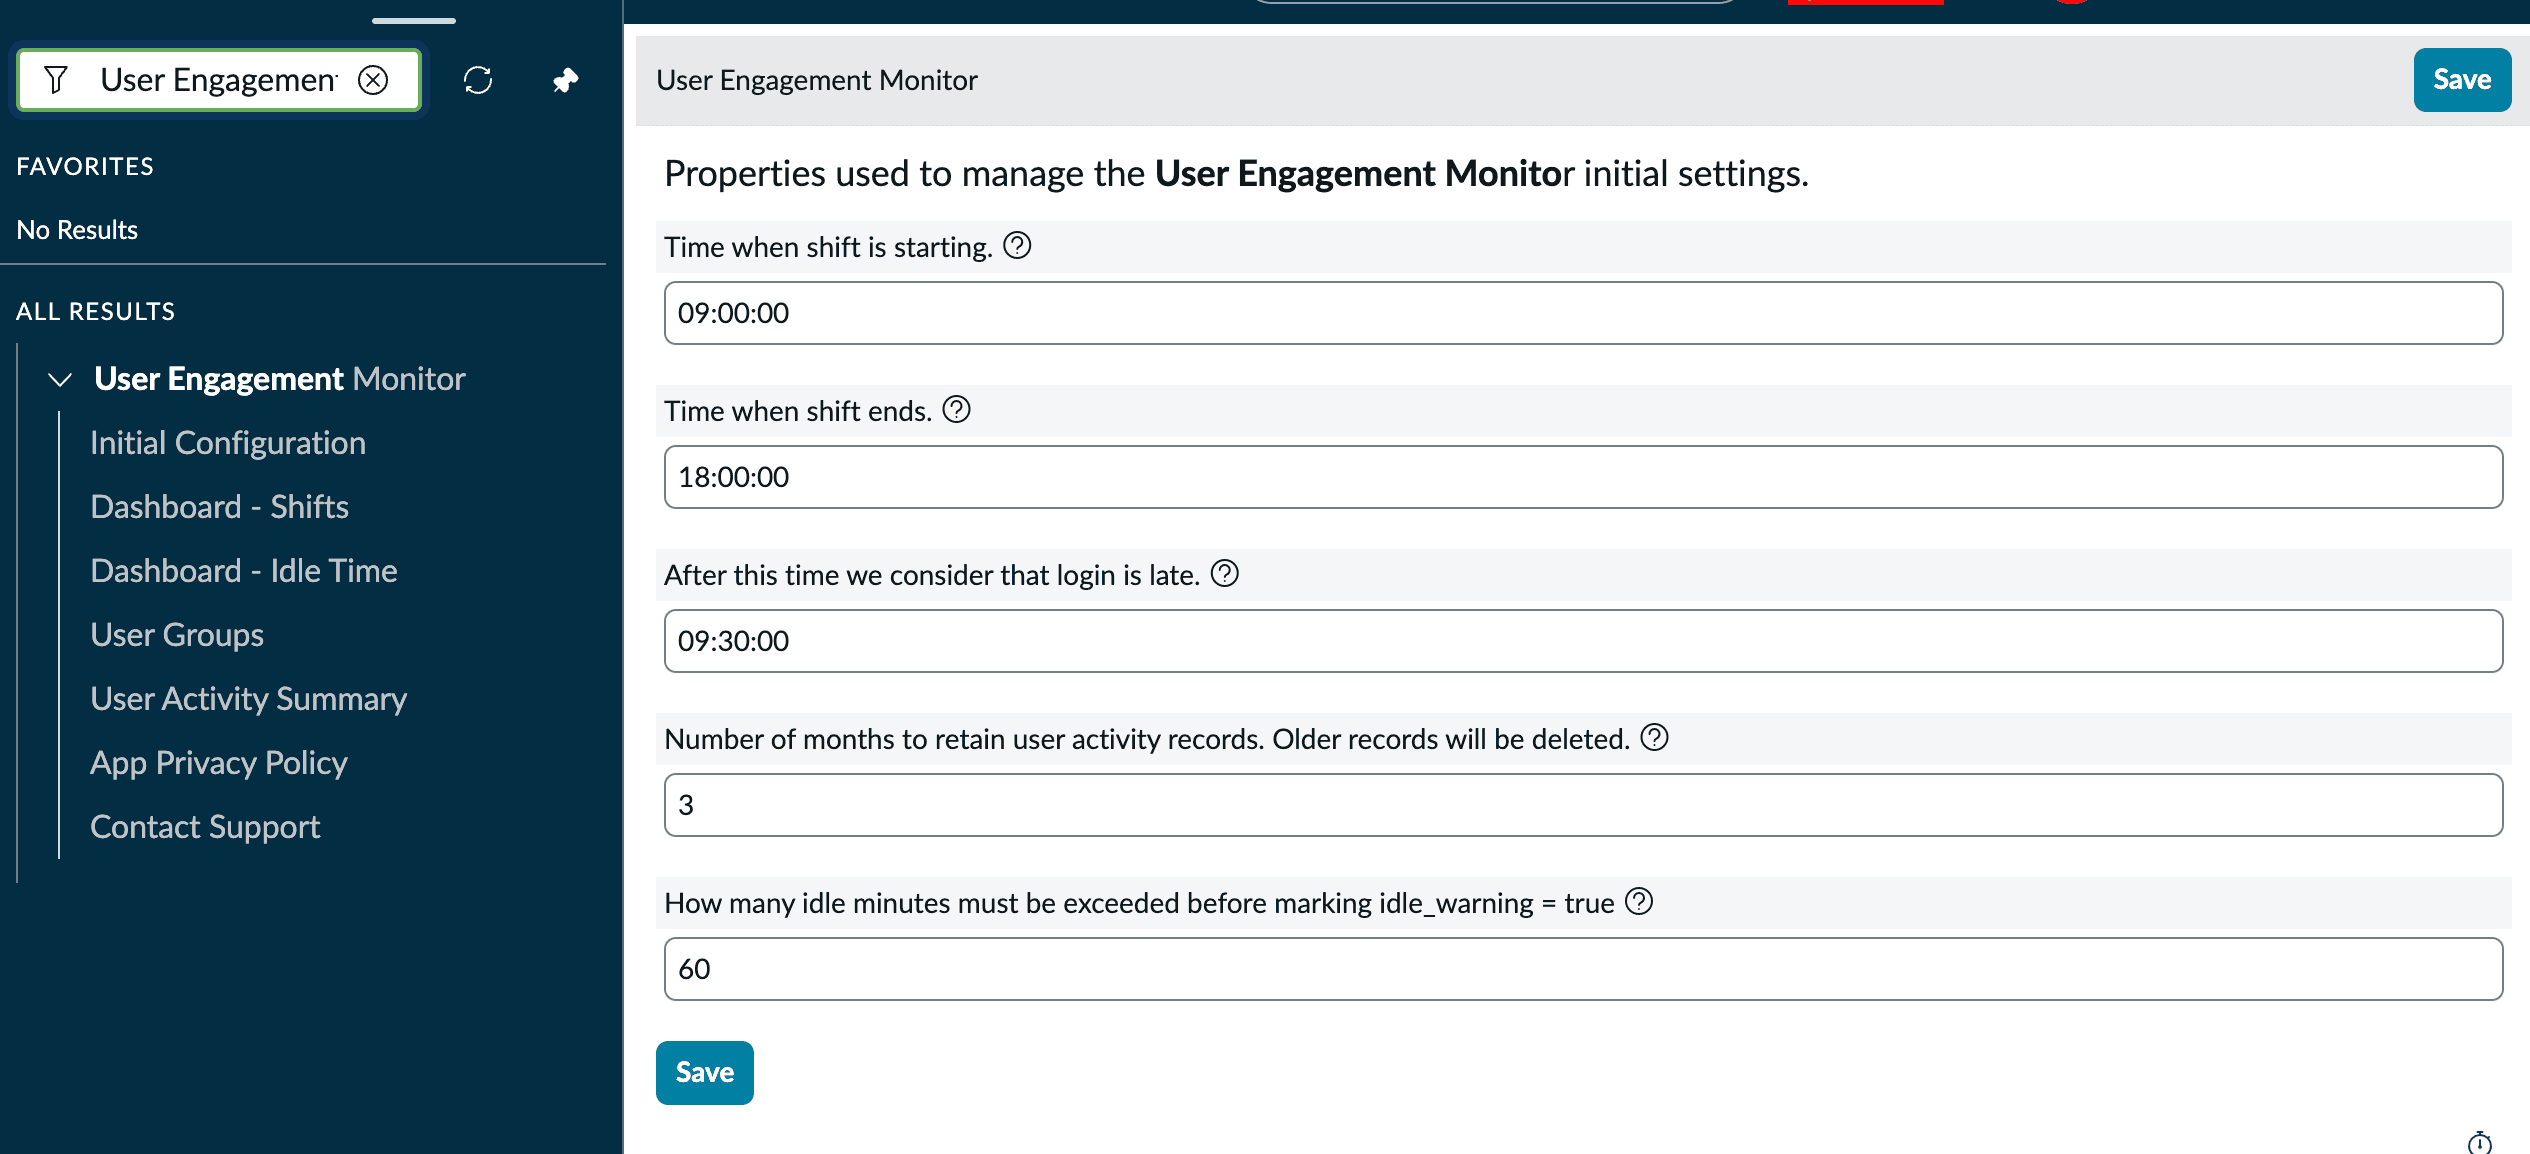
Step 2: Configure System Properties
The app uses system properties to stay flexible and environment-agnostic. At a minimum, review and set:
1. Shift Properties (examples):
- Shift start time (e.g., 09:00:00)
- Shift end time (e.g., 18:00:00)
- Late login cutoff (e.g., 09:30:00)
Navigate to System Properties (or a dedicated “User Engagement Monitor” properties module, if provided in the app) and update values to match your organization’s standards.
Step 3: Set correct Time Zone in your instance
This ensures that features of app will work correctly
1. Go to System Properties > Basic Configuration.
2. Change “System timezone for all users unless overridden in the user;s record” to your actual time zone

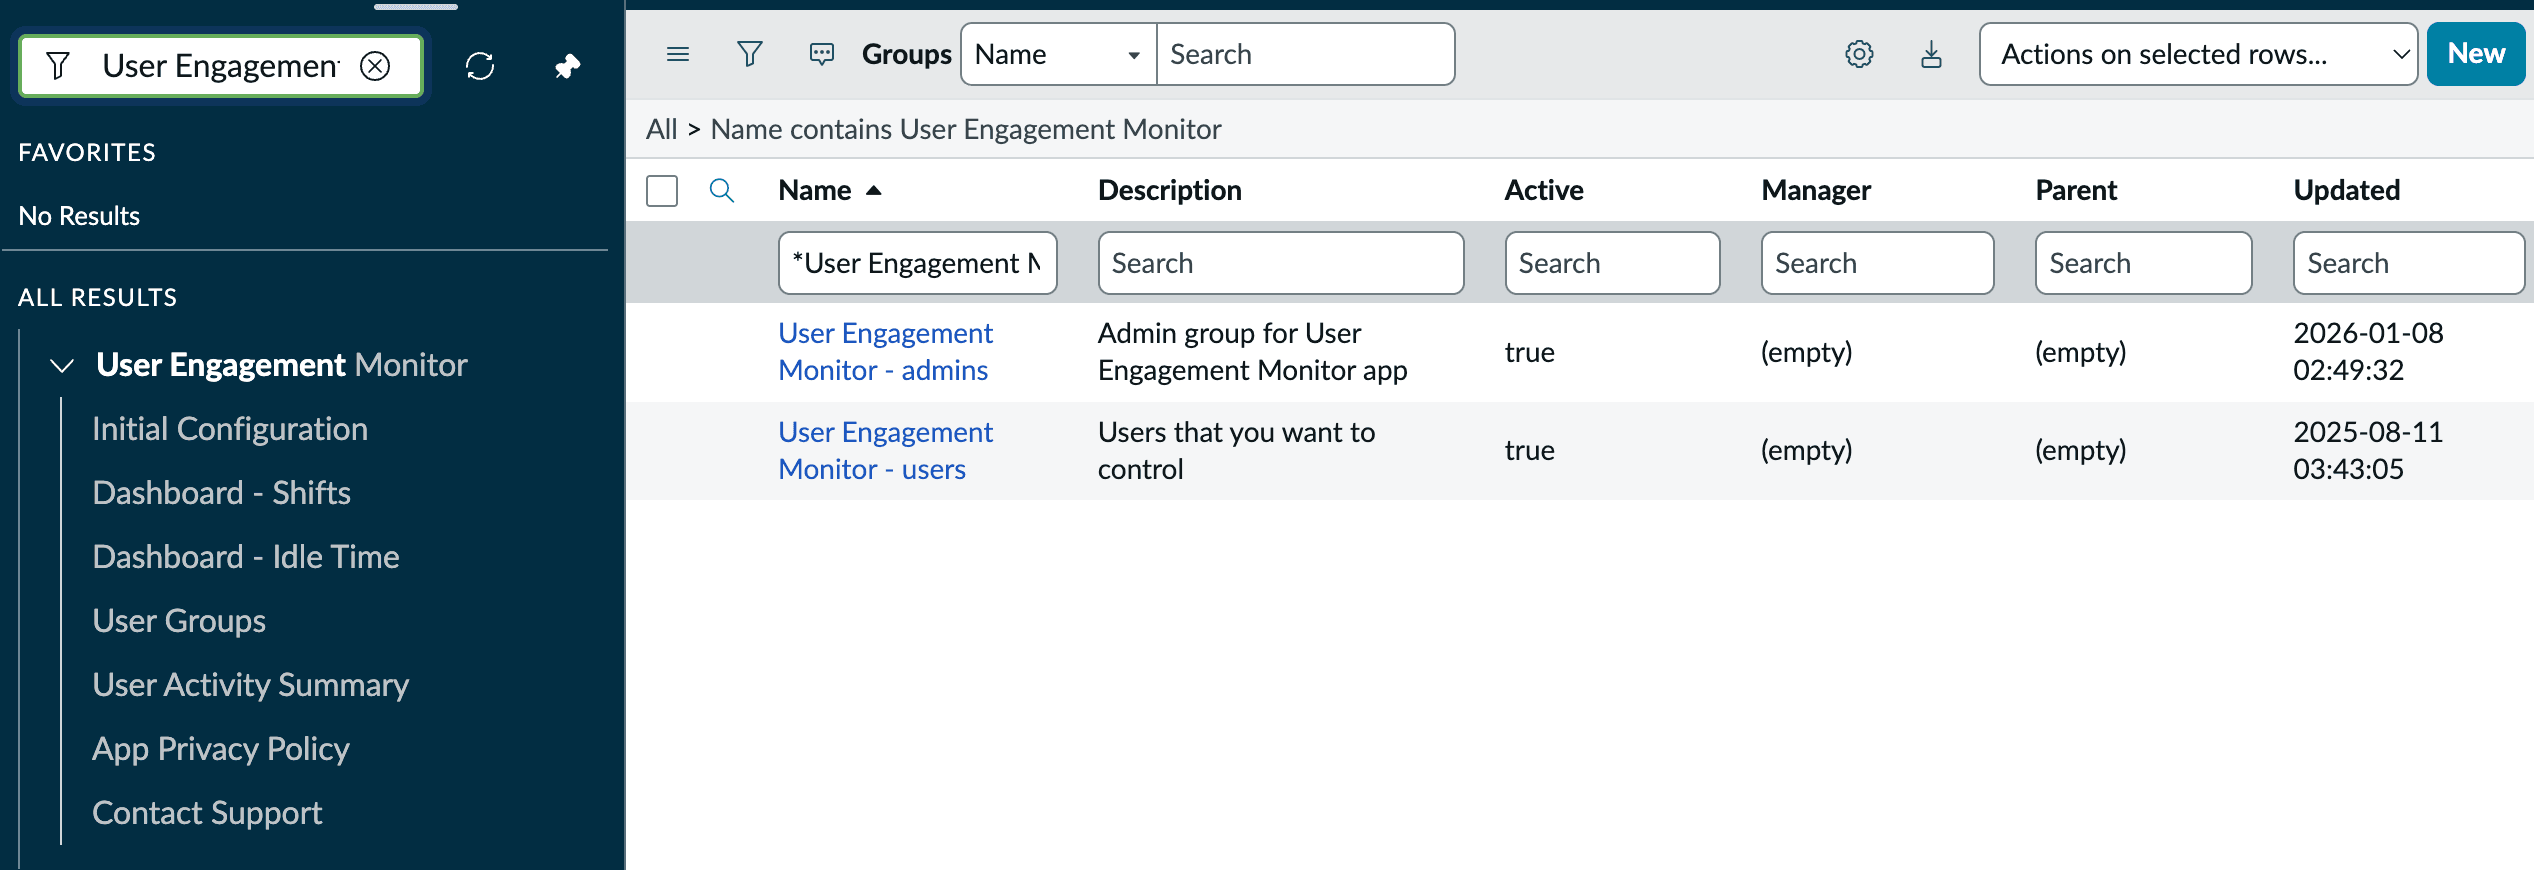
Step 4: Add Users to the Monitoring Group
The app typically uses a dedicated user group to decide whose activity should be monitored (e.g., User Engagement Monitor - users).
3. Go to User Engagement Monitor > User Groups.
4. Open the designated monitoring group.
5. Add all users (or test users) whose engagement you want to track.
6. Add admins that will be tracking other users
7. Save the group.
Only sessions for these users will be processed by the monitor, which helps control scope and data volume.
Step 5: Run the Scheduled Jobs (First-Time Initialization)
After configuration, you may want to populate data immediately.
1. Go to System Definition > Scheduled Jobs
2 .Locate the jobs installed by the app, for example:
- User Activity Summary Global
- Idle Time (Global Scope)
3. For each job:
- Open it.
- Click Execute Now to run once and generate data for today.
- Make sure to first run User Activity Summary Global and only then Idle Time (Global Scope)
Once tested, ensure both jobs are Active so they run automatically at their defined schedule (e.g., nightly).
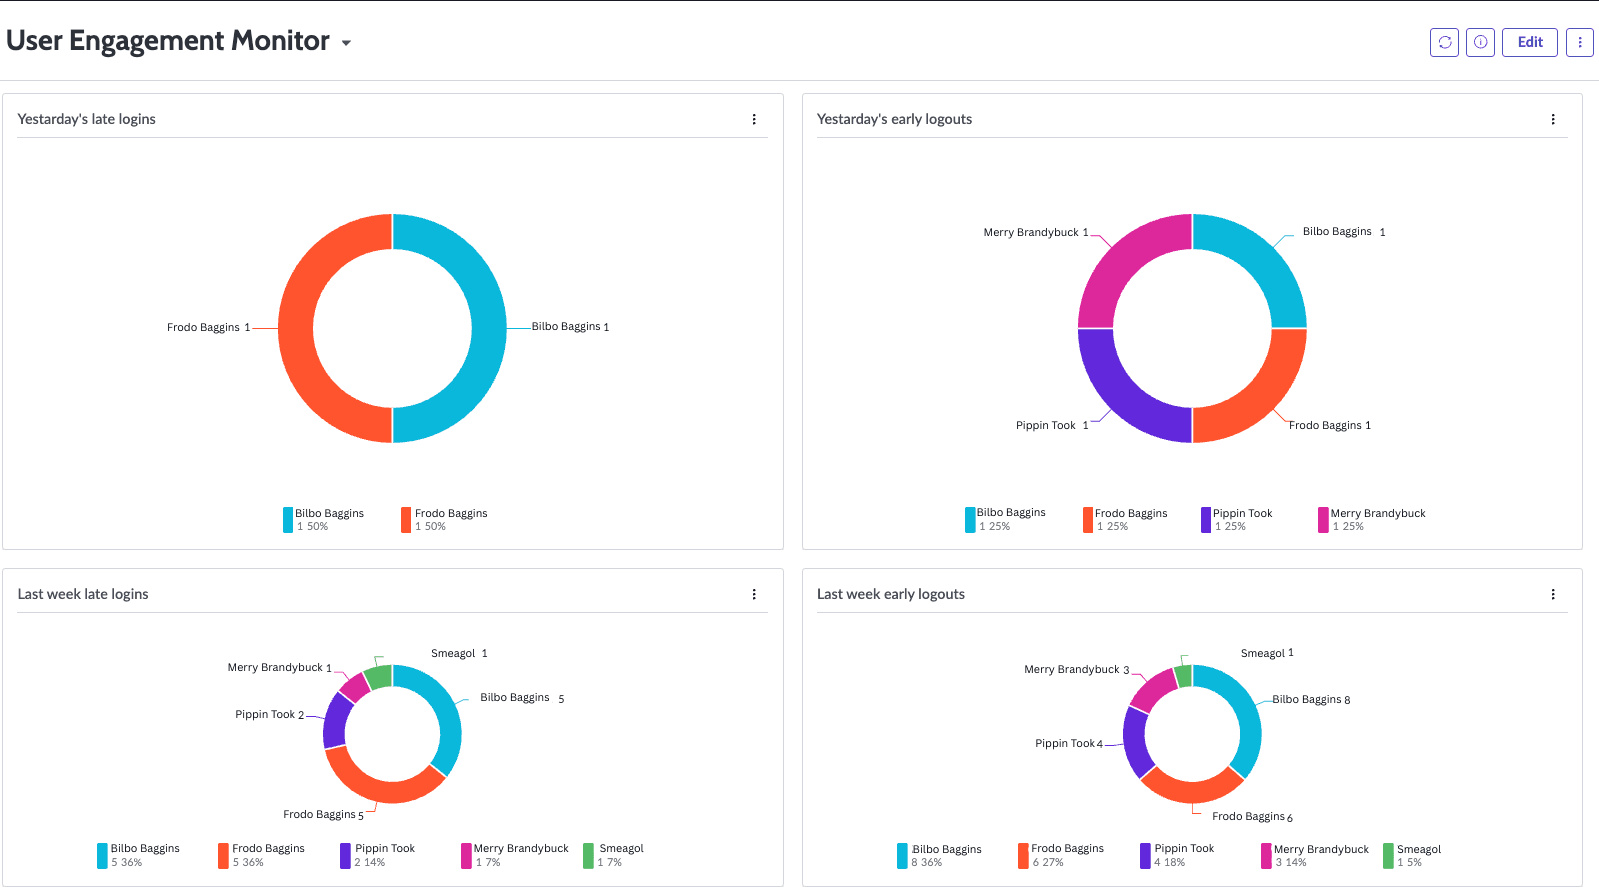
Step 6: Explore Dashboards and Reports
Finally, open the provided dashboards:
1. Go to the User Engagement Monitor > Dashboard
2. Review widgets such as:
- Late logins by day
- Early logouts
- Session counts and durations
- Idle time per session
- Total idle time per user
- Active vs idle comparisons
- Users exceeding idle warning thresholds
Within a few hours of installation and configuration, you’ll have meaningful, visual insight into real engagement behavior across your ServiceNow users.
Example Use Cases
- Service Desk and Call Centers
Monitor if agents are logged in on time, staying online during critical hours, and actively handling work. - IT Operations and Engineering Teams
Identify whether long sessions correspond to real work or simply open tabs with little engagement. - Compliance and Audit
Provide auditable records of working patterns and platform engagement during defined shifts.
Conclusion
The User Engagement Monitor developed by DSS delivers a unified solution for tracking how users engage with ServiceNow:
- Shift adherence - who is late or leaving early
- Session duration - how long users are logged in
- Idle time analysis - how much of that time is truly active
By distinguishing between “logged in” and productively engaged, the application enables organizations to make smarter, data-driven decisions that improve productivity, compliance, and operational efficiency.
Once the combined update set is imported, properties configured, users added, and jobs scheduled, you have a powerful, automated insight layer on top of your ServiceNow usage - ready to support both IT and business stakeholders.
To support onboarding, a dedicated YouTube video guide is available, walking through installation, configuration and daily usage step by step. In case any questions or issues arise, experienced specialists at DSS are available to quickly support, troubleshoot and help ensure the solution runs smoothly in your ServiceNow environment.
→ You can download the XML file for the User Engagement Monitor from this link.
→ You can download the step-by-step guide to install and use the User Engagement Monitor.
FAQ
1. What is the User Engagement Monitor for ServiceNow?
The User Engagement Monitor for ServiceNow is an application developed by DSS that tracks user login behavior, logout times, session duration, idle time and active time to help organizations improve productivity, compliance and operational visibility.
2. Why use a User Engagement Monitor in ServiceNow?
A User Engagement Monitor helps organizations understand how employees use ServiceNow by identifying late logins, early logouts, long idle periods and actual active time, allowing managers to address productivity and compliance issues proactively.
3. How does the User Engagement Monitor track idle time in ServiceNow?
The User Engagement Monitor analyzes syslog_transaction data and measures gaps between meaningful user actions such as form loads, list views, searches and reports. Any gap above the configured idle threshold is counted as idle time.
4. What insights does the User Engagement Monitor provide?
The User Engagement Monitor provides insights such as late logins, early logouts, total session duration, idle time, active time, average session lengths, users exceeding idle thresholds and engagement trends across teams.
5. Can the User Engagement Monitor be configured for different shifts?
Yes, the User Engagement Monitor uses configurable system properties for shift start time, shift end time and late login cutoff time, making it flexible for different departments, teams and time zones.
6. How do you install the User Engagement Monitor in ServiceNow?
To install the User Engagement Monitor, administrators import the update set XML file, preview and commit the update set, configure system properties, set the correct time zone, add users to the monitoring group and run the scheduled jobs.
7. What dashboards and reports are included in the User Engagement Monitor?
The User Engagement Monitor includes dashboards and reports for late logins, early logouts, session duration, idle time per session, total idle time per user, active versus idle comparisons and users exceeding warning thresholds.
8. What are the business benefits of the User Engagement Monitor for ServiceNow?
The User Engagement Monitor improves productivity, supports compliance, reduces manual log analysis and enables data-driven decisions by giving organizations clear visibility into how users engage with ServiceNow during working hours.


